

DMTN-313
Report from Operations Rehearsal 5#
Abstract
Report from Operations Rehearsal 5 as of March 11 2025.
There was another round of tests week of April 7th 20245, which will be incorporated soon
Introduction#
The question we sought out to answer during Operations Rehearsal 5 (OR5) was:
Can Rubin Data Management (DM) keep up with LSSTCam-scale data processing?
where LSSTCam-scale mean:
800 visits per night, each visit composed of 189 detectors;
Processing that includes both:
DRP-style batch processing, and
Prompt Processing (AP) at the US Data Facility (USDF).
Goals of OR5#
The goals were to identify and resolve bottlenecks ahead of LSSTCam on-sky commissioning in the following payloads.
Batch: Demonstrate processing of 800 visits in 24 hours using the Nightly Validation pipeline (coadds, no DIA). This pipeline provides a shorter test of a subset of tasks included in the full DRP pipeline. Processing time needs to keep up with observing (i.e. one weeks worth of LSSTCam images should make it through a DRP in < one week)
Prompt: Demonstrate prompt processing at design cadence (~37 seconds per image) using replayed simulated images.
This rehearsal was conducted entirely within DM at the USDF, with no summit component. The load was applied to many layers of infrastructure simultaneously and includes, but is not limited to:
embargo rack: storage and network
/sdf/group (weka): shared software stack
batch nodes: 72 Milanos (120 cores each)
Kubernetes Embargo nodes (d-nodes)
PostgreSQL: for the Butler registry
Cassandra: for APDB
Kafka: for nextVisit events and for alert distribution
The capability to meet these challenges depends on the full DM stack. Representatives from campaign management, pipelines, middleware, and the data facility (S3DF) participated, monitored, and troubleshooted throughout OR5.
Experiment Setup#
We prioritized successful execution over strict experimental design. Fixes discovered on one day were immediately applied to subsequent tests. This approach enabled rapid progress, but it means that comparisons across days (e.g., HTCondor vs PanDA, w_2025_08 vs w_2025_09) are not controlled experiments. The data is valuable for operational insight, but not suitable for rigorous benchmarking.
To generate load, we copied 10 days of LSSTCam-imSim data (DESC DC2 Run2.2i) into the embargo rack:
7 days of Wide-Fast-Deep (WFD)
3 days of Deep Drilling Field (DDF)
We ingested this into the butler repo,embargo_or5, ignoring timestamps: the first 800 visits were treated as day one, the next 800 as day two, and so on.
Since commissioning data resembles DDF in cadence, we consider DDF more representative of near-term operational expectations.
All logs and issues are documented:
Discussion and real-time debugging were captured in the #ops-rehearsals Slack channel.
Batch Processing#
Setup#
We conducted three one-day batch processing tests during OR5:
Day |
Date |
WMS |
Pipeline |
Dataset |
|---|---|---|---|---|
1 |
Feb 27 |
HTCondor |
w_2025_08 |
WFD |
2 |
March 4 |
HTCondor |
w_2025_09 |
DDF |
3 |
March 6 |
PanDA |
w_2025_09 |
WFD |
The original goal was to span a 2×2 test matrix:
Workflow management system: HTCondor vs PanDA
Dataset type: Wide-Fast-Deep (WFD) vs Deep Drilling Field (DDF)
However, we prioritized successful execution over strict matrix coverage. Not all combinations were tested exactly once, and some experimental conditions changed between runs.
Batch Test 1: WFD, w_2025_08, HTCondor#
Configuration:
Date: 2025-02-27
Dataset:
2.2i/raw/OR5/WFD/day1/DM-48585Pipeline version:
w_2025_08Workflow manager: HTCondor
submit_dir:
/sdf/group/rubin/shared/campaigns/LSSTCam-imSim-OR5-htcondor/submit/LSSTCam-imSim/OR5/runs/nightlyValidation_day1/w_2025_08/DM-4917
We ran 800 visits of WFD-mode data through the Nightly Validation pipeline using HTCondor and w_2025_08.
The software stack was mounted via CVMFS, and Butler’s caching behavior was customized to reduce pressure on the embargo rack:
Normally,we configure the Butler to use a 500-dataset cap for local cache.
We increased this to 1 TB, allowing local re-use of calibration data across jobs.
This tuning was motivated by known I/O bottlenecks during instrument signature removal (ISR). ISR requires multiple calibration frames per detector (bias, dark, flat, etc.), resulting in substantial read load from the embargo rack.
To mitigate this, we experimented with detector-level clustering via BPS. This strategy, which groups quanta by detector ID, sends each detector’s jobs to a single node, thus reducing redundant reads. However, as of February 27, naively clustering by detector caps the number of parallel jobs at 189 — far below the 8,000+ cores available. To scale up:
The 800 visits were divided into 53 groups, each covering ~15 visits.
Each group was submitted as a separate BPS submission.
Within each group, clustering by detector was applied.
This approach maintained the locality benefits while increasing total concurrency via parallel submissions. The need for manually submitting mulitple groups has since been resolved on DM-49240.
Observations#
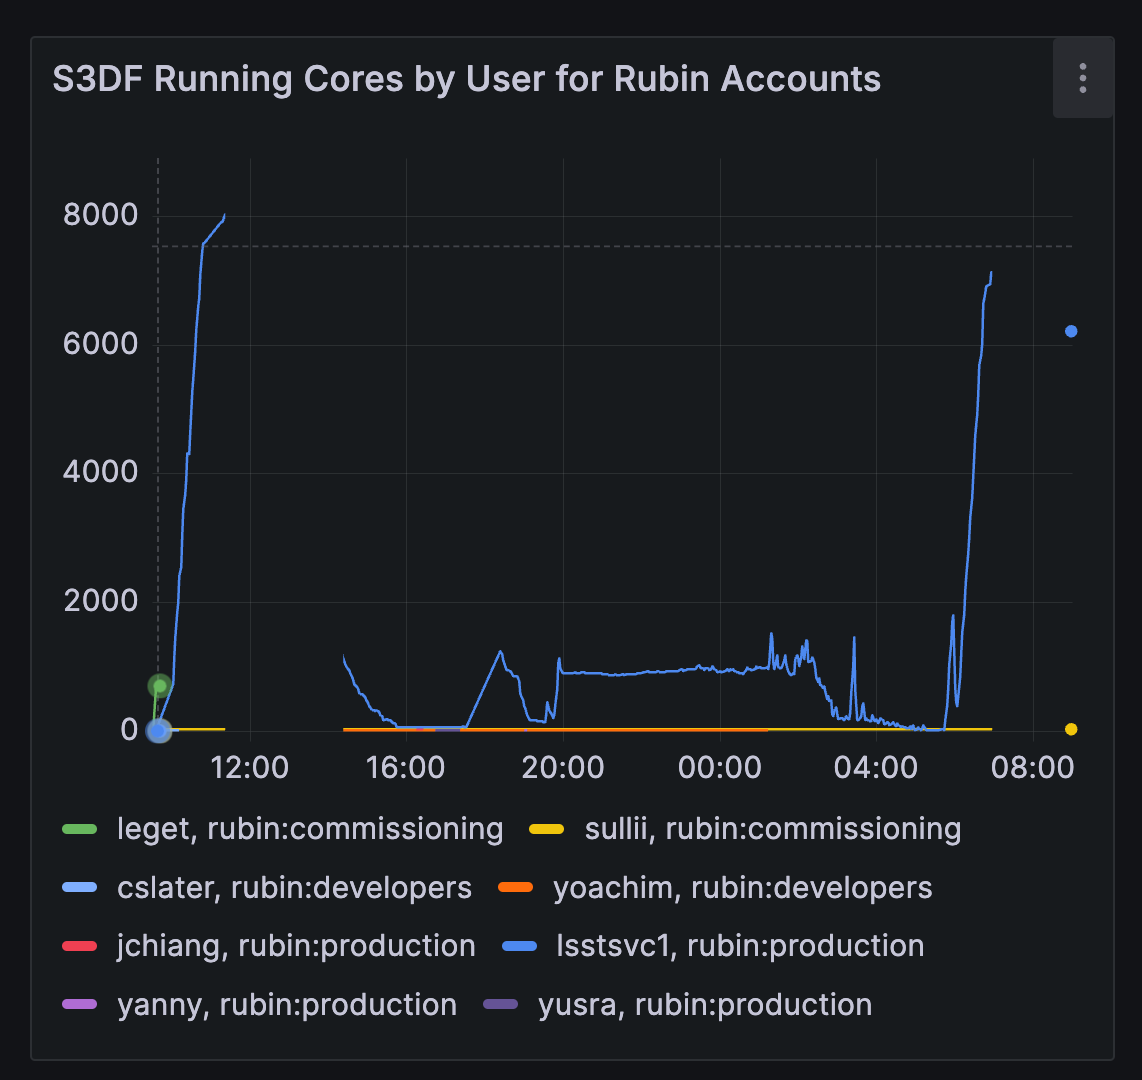
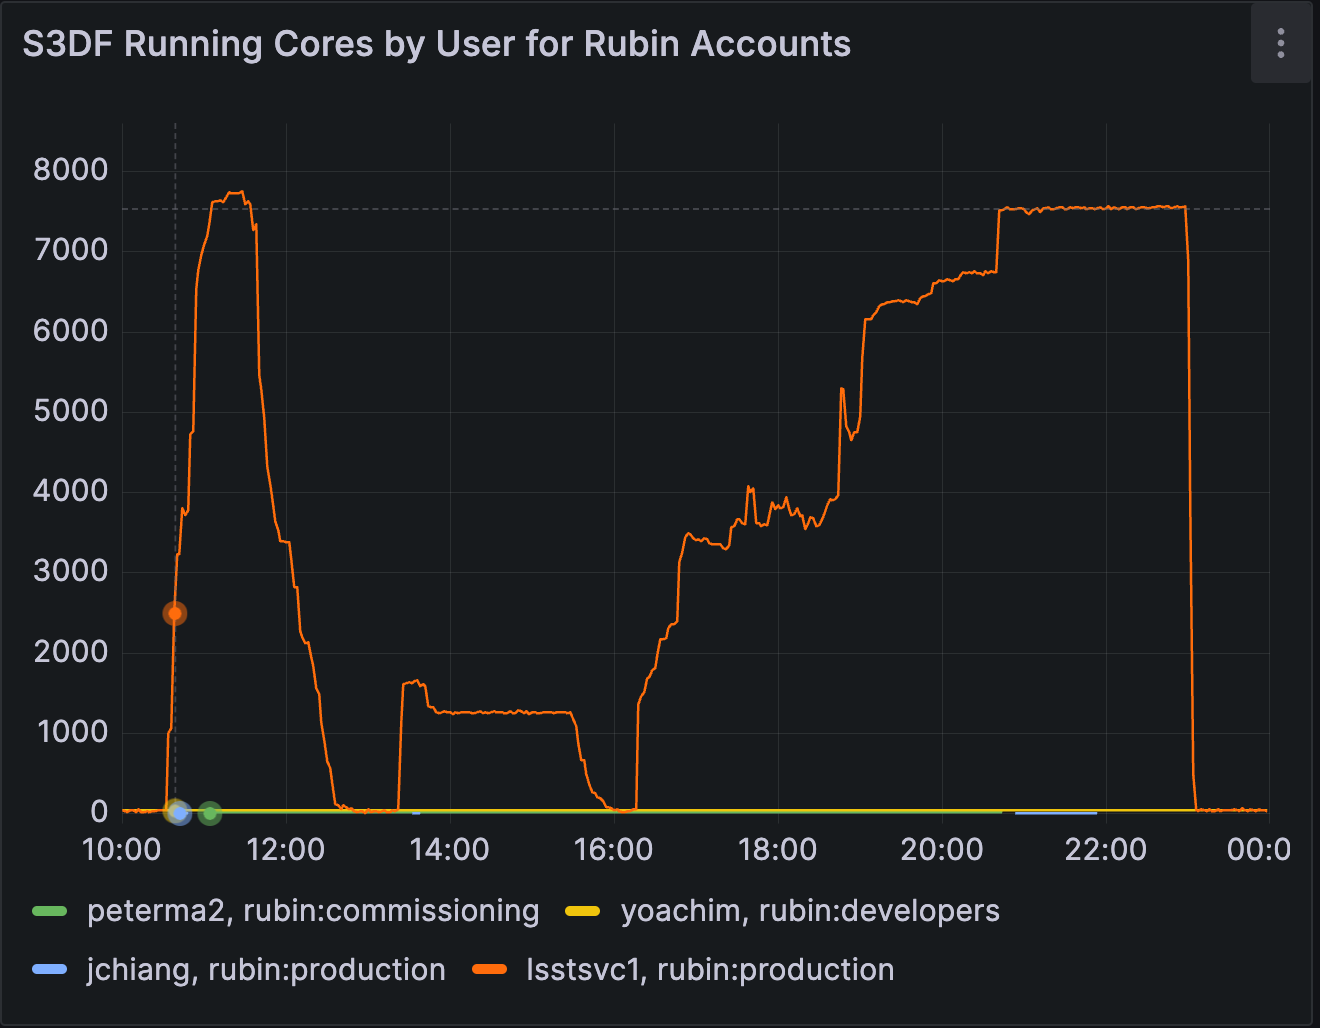 Allocated cores for batch test 1 show steps 1, 2 and 3 of the nighly validation pipeline payload.
The above figure shows the progression through the pipeline stages, as seen in allocated CPUs:
Step 1: Near-saturation of available cores. ISR and early steps were well parallelized, and cluster utilization approached the ~8,000 core ceiling.
Step 2: Underutilization (~800 concurrent jobs) due to
finalizeCharacterizationbeing parallelized by visit instead of detector. This was addressed in DM-48932.Step 3: Underutilization had multiple causes:
4000 core plateau: Idle time due to short-duration
makeDirectWarpandmakePsfMatchedWarptasks being scheduled independently. These were later clustered in DM-49246.6500 core plataeu: Slurm failed to preempt low-priority jobs, limiting throughput. Manual intervention was required.
Final drop at 23:00: Jobs came to a halt because the HTCondor database filled its 25 GB partition limit. This was fixed the following day by moving it to a larger volume (DM-49296).
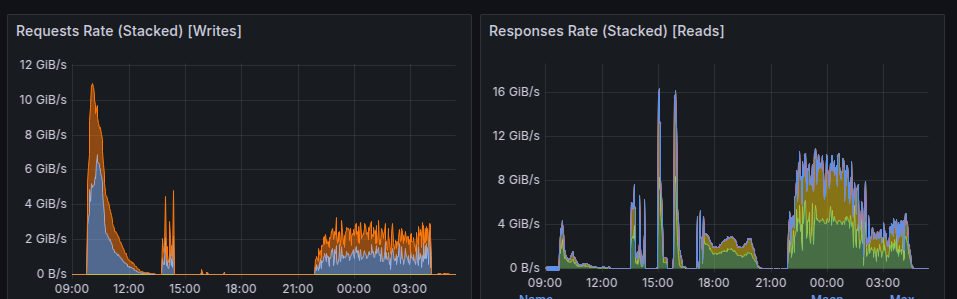
I/O Behavior:
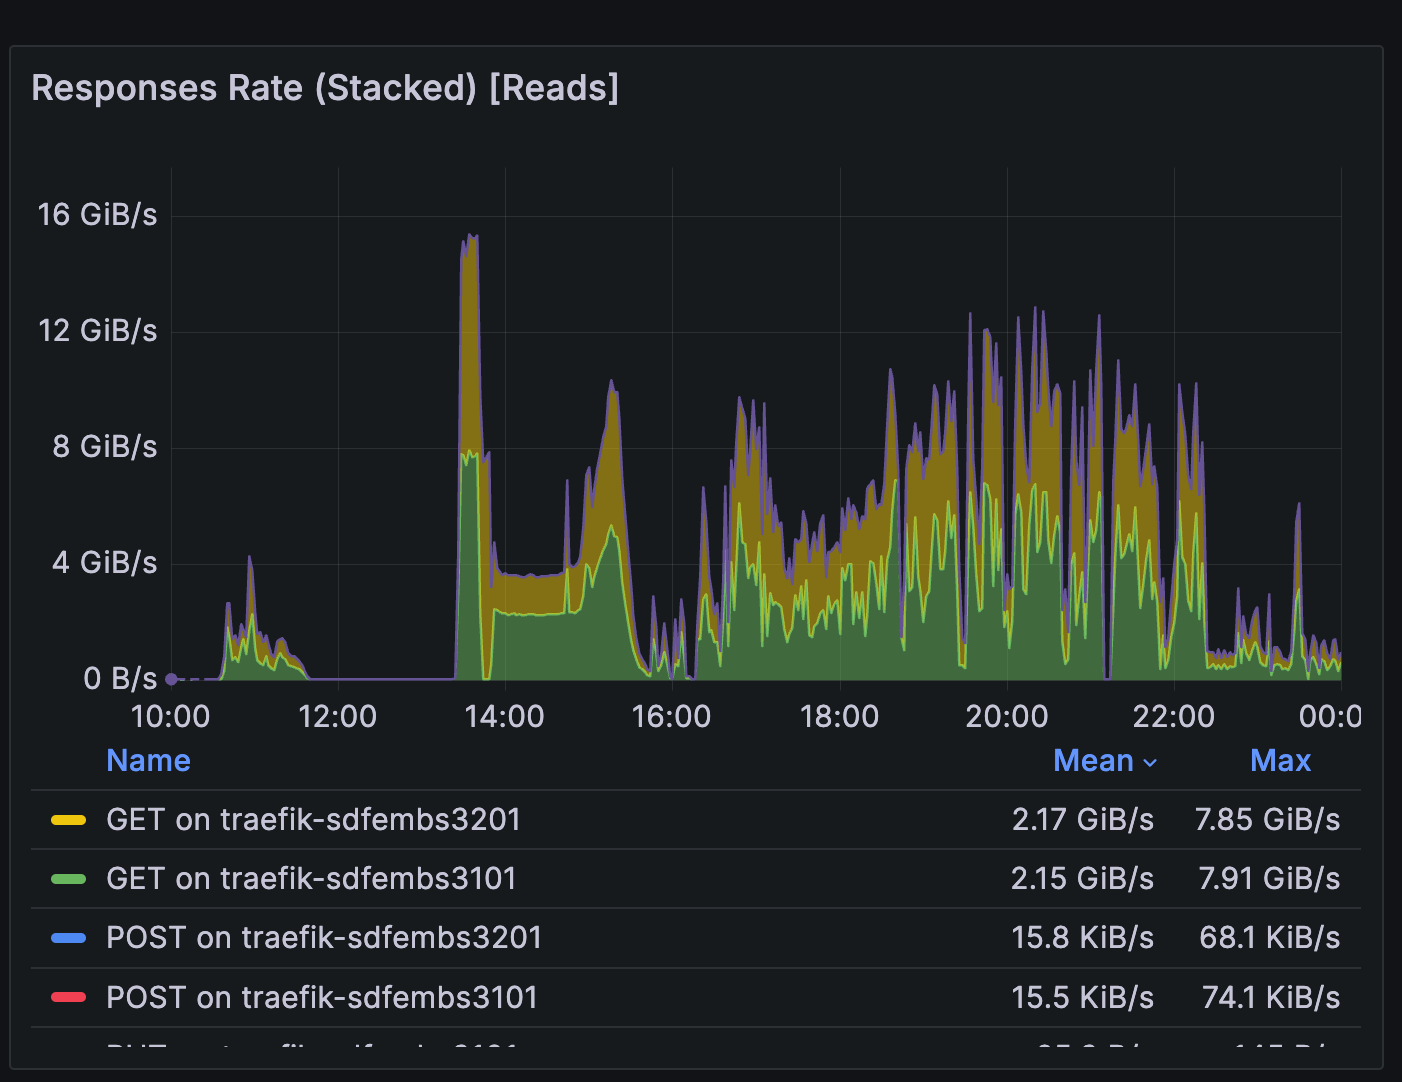
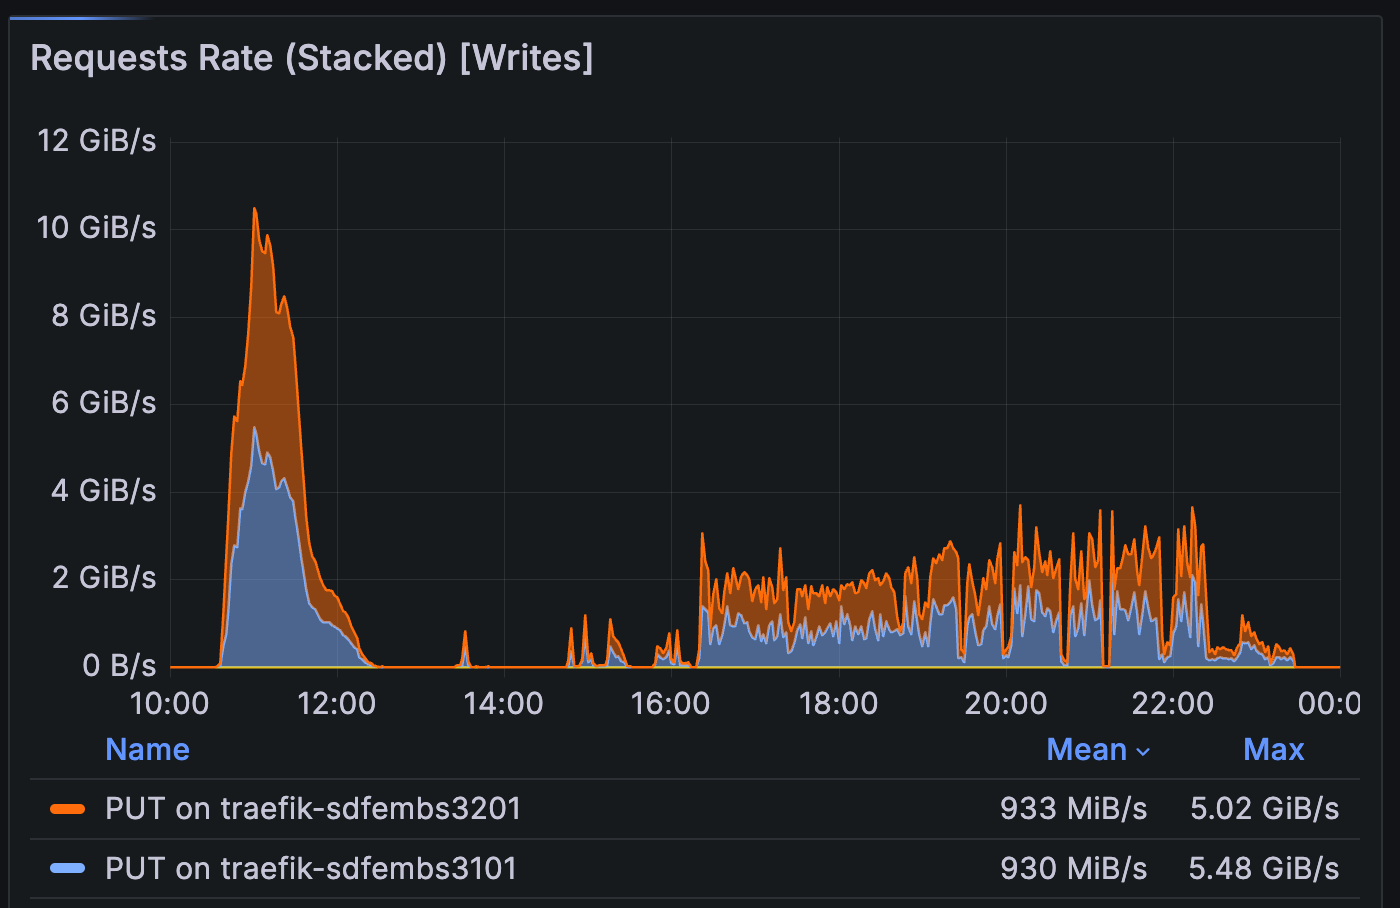 Read and write volume from/to the embargo rack during batch test 1
Read throughput was high but stable. The per-detector clustering approach (53 groups × ~15 visits) successfully filled the cluster while improving cache locality, minimizing embargo rack reads during ISR.
A notable spike occurred during
ConsolidateVisitSummaryTask, with read rates exceeding previous observations. This prompted an investigation into more efficient metadata access, tracked in DM-49314.Write patterns during coaddition matched expectations for I/O-intensive stages.
Additional Observations: During the test, AuxTel was observing, and calibration frames were being transferred and ingested to the embargo rack. In the past, this dual load caused ingest problems—but in this test, AuxTel ingest operated normally. The successful ingest alongside active science processing suggests that the embargo rack and I/O infrastructure can now sustain concurrent operational loads, with the caveat that LATISS data is only one detector and this may not hold for LSSTCam.
In summary, this test demonstrated that detector-level clustering is an effective strategy for ISR-heavy stages. Several bottlenecks (graph generation, slurm scheduling, task parallelism) were found and have clear mitigation paths.
Batch Test 2: HTCondor, DDF#
Configuration:
Date: 2025-03-04
Dataset:
2.2i/raw/OR5/DDF/day1/DM-48585submit_dir:
/sdf/group/rubin/shared/campaigns/LSSTCam-imSim-OR5-htcondor-newday/submit/LSSTCam-imSim/OR5/runs/nightlyValidation2_day1/w_2025_09/DM-49179Pipeline version:
w_2025_09Workflow manager: HTCondor
Submission details:
Allocated 8,000 cores at the start
--autoresource allocation from that point onwardBPS submissions: 53 groups, 20 seconds between submissions (down from 50s on Day 1)
Step 3 split into 20-patch groups to avoid quantum graph (QG) memory errors
Observations#
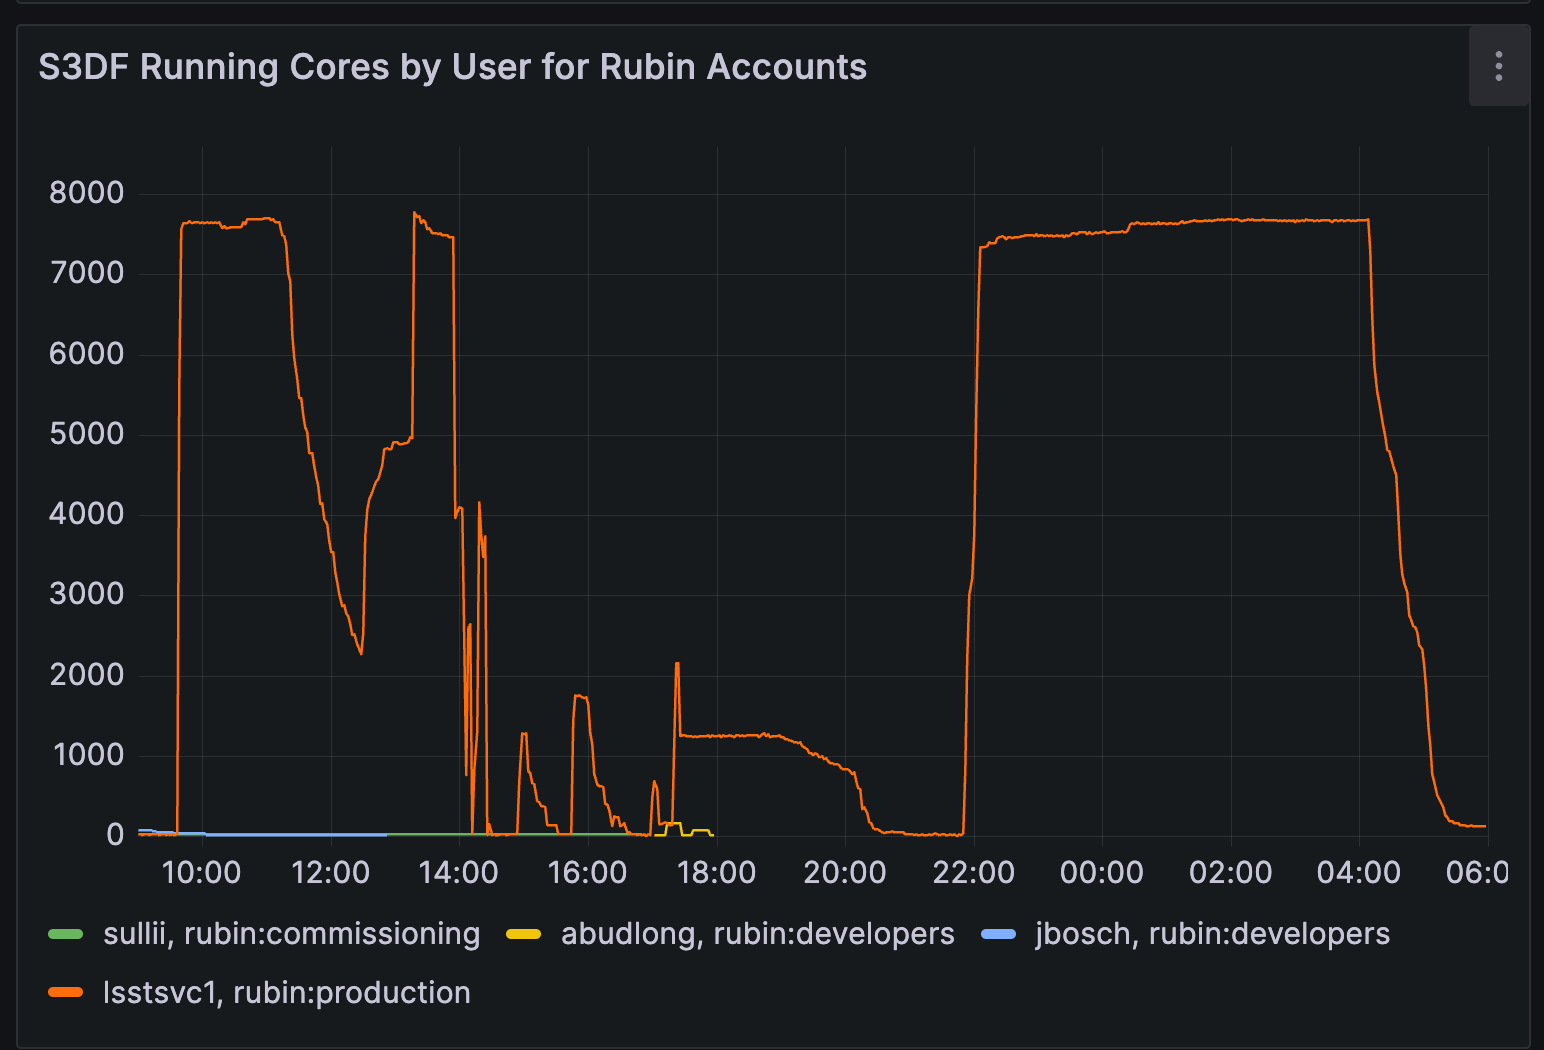 Allocated cores for batch test 2 show steps 1, 2 and 3 of the nighly validation pipeline payload. The increase in cores between 12:00 and 14:00 correspond to jobs submitted outside of OR5
Step 1 took significantly longer than Day 1, despite reduced submission spacing.
This was partly due to pipeline errors triggered by insufficient refcat coverage in the DDF region. The failures led to retries extending runtime.
As Step 1 was wrapping up, an unexpected load appeared on the cluster.
It was traced to an unmonitored PanDA dev instance that began launching jobs mid-test.
USDF staff attempted to cancel them using
scancel, but PanDA’s persistent retry mechanism continually respawned jobs.Ultimately, direct cancellation by the PanDA devs who launched the jobs was required to stop the runaway job spawning.
Node
sdfmilan124only had 40GB of/lscratchand was manually drained.
Takeaways
Step 1 runtime doubled due to a combination of pipeline retries and reduced concurrency. Monitoring data confirmed fewer concurrent jobs than Day 1, contributing to slower throughput.
The PanDA runaway job scenario revealed a gap in local operational control. USDF staff lacked a reliable way to terminate PanDA job submission from external controllers which revealed a gap in local operational control.
The out of memory failures in quantum-graph generation that required multiple submissions of group3 has been mitigated on DM-49296.
Batch Test 3: PanDA, WFD#
Configuration:
date: 2025-03-06
Dataset:
2.2i/raw/OR5/DDF/day1/DM-48585submit_dir:
/sdf/group/rubin/shared/campaigns/LSSTCam-imSim-OR5-PanDA/DDF_day1Pipeline version:
w_2025_09Workflow manager: PanDA
submission details:
Step 1: 20s between BPS submissions
Observations#
 Allocated cores for batch test 3. InfluxDB issues led to gaps in monitoring data, but three distinct processing phases are still visible.
This run included the addition of
pipetask reporttofinalJob. Runtime was over an hour due to resource contention. At these scales, we decided that it takes too long to block the submission of the next processing stage. In scenarios where the output ofpipetask reportis not necessary before submitting to next stage, it should be run in parallel with submitting the next job.All steps took ~3× longer than in the earlier HTCondor runs, a discrepancy visible in both wall time and CPU time.
One Step 3 group failed to submit (1 out of 10), which underscores the need for consistent campaign maangement tooling.
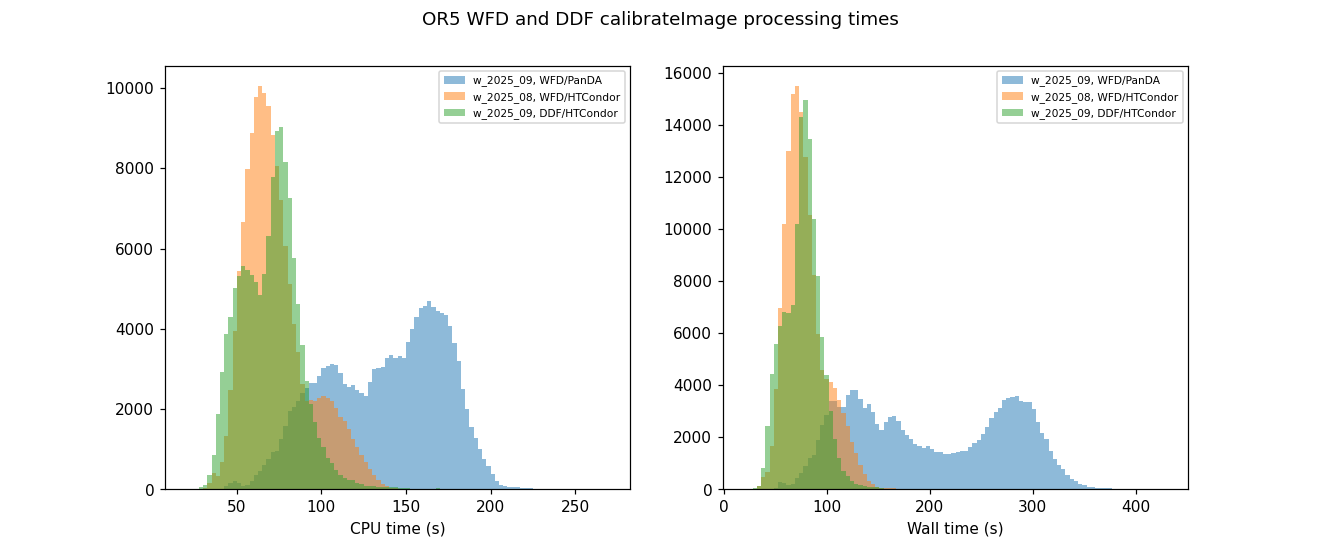 CPU time (left) and wall time (right) for
 CalibrationImageTask for the first three batch tests
CPU runtime was significantly inflated on Day 3 compared to the same tasks in Batch Test 1.
Actual core usage was also low relative to available capacity, suggesting inefficiencies in how PanDA-managed jobs were scheduled and executed.
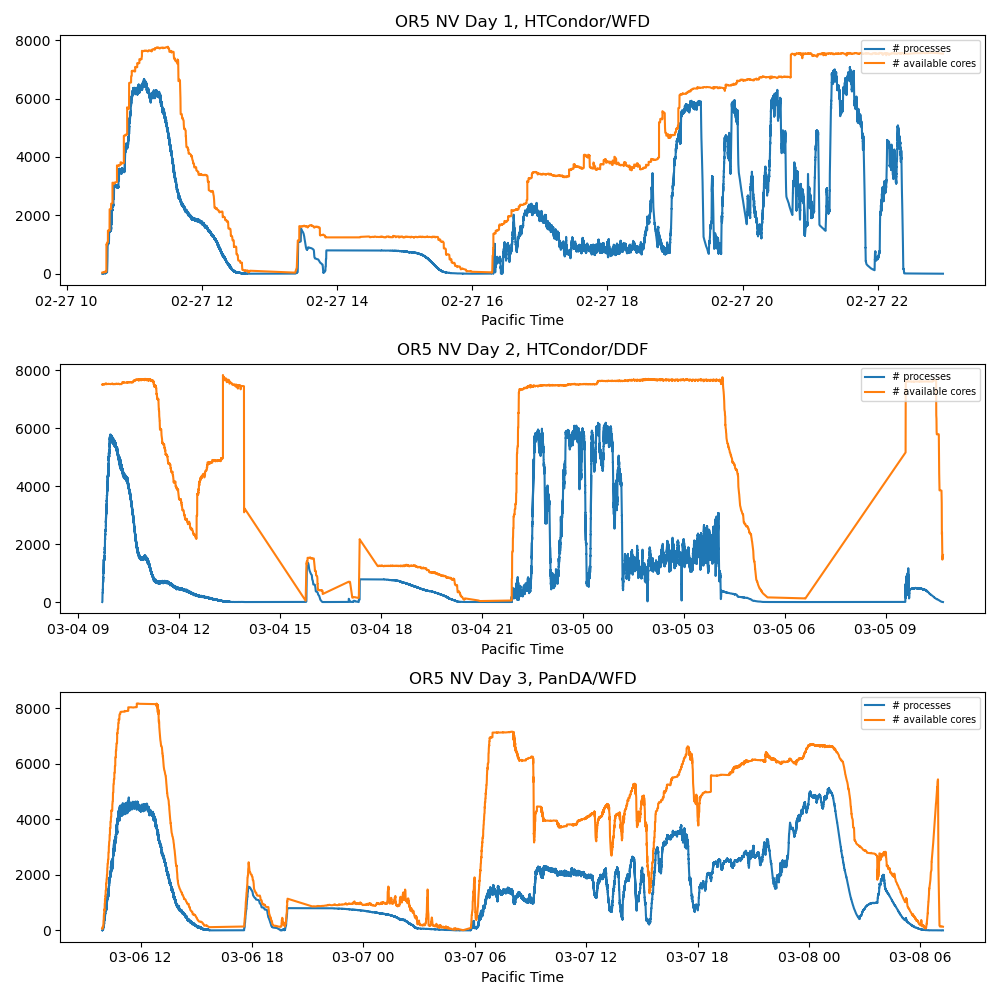 pipetask processes running concurrently as a function of time from Task Metadata (blue). Number of cores allocated (orange)
 *Traffic in and out of the embargo rack for Day 2. Some of the drops in core usage are correlated with embargo rack traffic”
These figures compare the number of concurrent
pipetaskprocesses (from task metadata) with available Slurm cores.Across all NV runs, efficiency was well below 100%. On Day 3, the gap between allocated and actively used cores was especially stark. Some drops are temporally correlated with network traffic spikes to and from the embargo rack, suggesting shared resource contention.
Performance Investigation#
An investigation is ongoing, but several key factors have been identified:
Monitoring limitations: It’s currently difficult to observe actual core utilization (vs allocations) in real time. Improving this has been a long-standing need. OpenSearch is partially in place, but full integration is pending. As of April this monitoring is in place for HTCondor workflows, but not PanDa workflows.
Node packing effects: Tests showed that tightly packing nodes—up to the full 120-core capacity—resulted in the same ~3× slowdown, even with HTCondor.
I/O contention:
pipetask reportjobs failed to finish, potentially due to I/O pressure on the scratch area.
Our current interpretation of the relative slowness during the PanDA-based batch test 3, points to two dominant factors: (1) caching behavior that funneled all intermediate outputs into a single monolithic directory and (2) increased node packing under PanDA, which scheduled more jobs per node on average compared to HTCondor. Earlier hypotheses that CPU pinning and L3 cache contention were causing the longer runtimes. Subsequent testing suggests those effects were less important, especially in fully packed configurations where such contention is unavoidable.
Batch Takeaways#
Better visibility into actual resource usage (vs allocations) is urgently needed.
The ability to monitor and control core-level behavior is essential for tuning and diagnosing end-to-end system performance.
This test illustrates why integrated, realistic rehearsals are essential: they reveal subtle yet impactful performance pathologies that wouldn’t emerge from unit or subsystem testing alone.
Batch Test Takeaways as of March#
The batch tests in OR5 demonstrated that Rubin’s data processing system can approach LSSTCam-scale throughput. Several bottlenecks were identified and resolved. Several unresolved issues must be addressed before on-sky operations:
Resolved
Quantum Graph (QG) Generation Gaps Gaps between pipeline stages due to slow or memory-intensive QG generation limited end-to-end throughput. Improvements in QG efficiency (e.g., step co-launching, graph splitting strategies) are essential. See: DM-49296
Step Parallelism Constraints Some tasks (e.g.,
finalizeCharacterization) were originally parallelized by visit, limiting concurrency. Refactoring to support per-detector execution restored full cluster utilization. See: DM-48932Short-Running Tasks and Scheduling Inefficiency Unclustered warp tasks were too lightweight to schedule efficiently; Clustering them resolved this. See: DM-49246
Non-optimal glidein size HTCondor jobs run on slurm glideins requested by
allocateNodes.py. Because 120 cores are available per node, the default configuration of 16-core glideins left120 % 16 = 8cores unavailble on each node. The simple resolution changed the default to 15 cores: See: DM-49246Infrastructure Configuration Limits Failures due to undersized HTCondor DB partitions and pipetask scratch I/O contention were resolved during the test but underscore the need for hardened configuration across all components.
Runtime Slowdown Jobs under PanDA ran 2–3× slower than equivalent HTCondor jobs. Subsequent tests point to butler cache contention resulting from more tightly-packed nodes, which can be mitigated by careful specification of cache subdirectories.
Unresolved as of April 19
Preemptable Job Handling Slurm failed to cancel preemptable jobs in real time, artificially capping core availability. This required manual intervention and highlights the need for improved job control logic. See: DM-49356
Monitoring Gaps We lack reliable, real-time visibility into actual core usage (vs allocations), making it difficult to diagnose underutilization or oversubscription. OpenSearch and improving job-level observability is a high priority. As of early April, this capability has been available for HTCondor workflows, but is still needed for PanDA workflows.
In summary: The batch processing system is fundamentally capable, but scheduler behavior, task configuration, infrastructure tuning, node reliability, and monitoring gaps must be addressed to ensure we can sustain DRP throughput at LSSTCam scale.
Prompt Processing#
Setup#
Data Configuration#
The prompt processing tests replayed the 800 exposures from the collection:
embargo_or5/2.2i/raw/OR5/DDF/day2/DM-48585
We intended to use distinct original exposures each day, but pracitcally repeated some visits during OR5. While this had no known impact on internal pipeline behavior, it was later flagged by alert brokers as problematic. In OR5.2, we ensured exposure uniqueness via overwriting their exposure timestamps to avoid confusing downstream consumers.
Replay was driven by a custom Python script that injected one exposure every 32 seconds, approximating the LSSTCam design cadence (30-second exposures plus overhead).
To support this, for OR5:
Each replayed exposure was assigned a new, unique exposure ID
The original
visitInfowas preserved to ensure valid calibration associations during OR5.A new
day_obswas assigned based on the replay time, resulting in some inconsistency betweenexposure timespanandday_obsmetadata — this was noted but had no observed operational impact
For OR5.2:
Instead of preserving the original
visitInfo, we updated it using the replay time.The mocked nextVisit events have consistent timestamps.
The full AP pipeline (ApPipe) was run, using:
Cassandra APDB
Kafka for alert distribution (alerts were published to the
alerts-simulatedtopic)
Infrastructure Configuration#
OR5 marked the first time prompt processing scaled to this level using production-adjacent infrastructure:
Embargo Kubernetes nodes (March):
28 nodes
48 cores / 256 GB RAM / 550 GB ephemeral storage each
Dedicated to prompt processing during OR5, though this exclusivity will not persist in commissioning
Embargo storage:
Previously reserved for summit data
Separate buckets provisioned for OR5
File notifications triggered auto-ingest and presence microservices, closely mimicking operational behavior
The system exercised both supported backend platforms at OR5:
Knative
KEDA
This was the first time either backend had been run at this scale for real-time prompt processing workloads.
Execution Plan#
Day |
Stack Version |
Pipeline Version |
Platform Order |
|---|---|---|---|
March 3, 2025 |
Prompt Service 5.1.1, |
|
Knative → KEDA |
March 5, 2025 |
Prompt Service 6.0.0, |
|
KEDA → Knative |
Each day replayed 400 visits using each platform, for a total of 800 visits per day, and 1,600 prompt runs overall.
Prompt Test 1#
Date: March 3, 2025
Stack version: Prompt Service 5.1.1 (d_2025_02_17)
Pipeline version: w_2025_09
Platforms tested: Knative → KEDA
Visits replayed per platform: 400 (total 800)
The first day of prompt processing was marked by a series of confusing and overlapping system failures. Upon closer investigation, most of the critical issues traced back to the PostgreSQL Butler registry, which became intermittently incapacitated under load.
Observations#
Registry Failures: Multiple errors with varied symptoms were ultimately traced to Postgres-related slowdowns in dataset transfer from the prompt workers back to the central repository. This occurred after processing was complete, but still within the execution lifecycle.
Worker Caps: Scaling plateaued well below expected levels:
Knative capped at ~1,000 concurrent workers
KEDA capped at ~1,300 This behavior was consistent across retries and may be linked to database or eventing constraints.
APDB Timeouts: Under stress, the Cassandra-based APDB experienced timeouts, likely a knock-on effect from the Butler registry and I/O contention.
Secondary Issues:
Driver script bugs
Ghost requests
Transient pipeline errors
Monitoring gaps
A rare race condition in startup
Due to the number and variety of failures, Day 2 testing was postponed to give teams time to:
Diagnose registry and APDB behavior under concurrent access
Address bugs and misconfigurations in the driver and orchestration stack
Implement scalable fixes to reduce contention
PostgreSQL resources were significantly increased in response, including CPU/memory and storage backend tuning.
This test highlighted the importance of end-to-end orchestration robustness, not just pipeline correctness. Even when processing succeeds at the task level, performance can collapse if product registration, dataset transfer, or metadata handling stalls downstream components.
Prompt Test 2#
Date: March 5, 2025
Stack version: Prompt Service 6.0.0 (d_2025_03_01)
Pipeline version: w_2025_09
Platforms tested: KEDA → Knative
Visits replayed per platform: 400 (total 800)
Day 2 of prompt processing was more structured and targeted. A new release (rubin-dev 10) was available, and the team established a control group to compare changes systematically.
Observations#
Middleware speed-up tests: Two proposed improvements to speed up dataset export were tested. Neither provided sufficient performance gains, confirming that the dataset export bottleneck remains unresolved.
Knative worker cap The team tested Knative’s ability to exceed its known concurrency cap by assigning 2 workers per pod. Result: the platform still capped at ~1,000 workers, indicating a broader systemic limitation.
“No export” control test: By disabling dataset export from workers to the central Butler repository, the team was able to:
Confirm that export was the primary bottleneck
Observe that pipeline execution and alert generation functioned smoothly
Identify memory availability as the only remaining scaling constraint (capped at ~1,500 workers with OR5 resources)
Quick Stack workflow exercised: The team deployed a custom-built stack with ticket branches, bypassing the formal release process. This “quick stack” path worked well and is expected to be critical for commissioning scenarios requiring rapid patch testing. A few integration issues were identified and documented.
Takeaways#
This test confirmed the dataset export system as the principal performance limiter at LSSTCam scale. With export disabled, the pipeline stack scaled well and ran reliably. The Knative worker cap remains under investigation, and KEDA may be favored for future high-concurrency tests. Memory availability currently defines the upper bound on parallelism.
OR5 marked the first time the prompt processing system was tested at LSSTCam scale. While core pipeline execution and alert delivery functioned as expected under load, several scaling and infrastructure bottlenecks were revealed that must be addressed before going on-sky.
Identified Issues#
Dataset Export Bottleneck
The dominant issue was a slowdown in dataset export from prompt workers to the central Butler repository.
The PostgreSQL registry could not sustain the metadata registration load at high concurrency.
Disabling export allowed the system to run smoothly, confirming this as the primary bottleneck.
A proposed architectural solution is documented in DMTN-310, suggesting the fix lies in re-architecting the prompt pipeline, not middleware tuning.
Knative Worker Scaling Limit
Worker counts in Knative capped around 1,000, even when deploying multiple workers per pod.
The root cause remains unknown, but this behavior was consistent across both prompt tests.
Future testing may shift emphasis toward KEDA, which performed better at scale.
Memory Constraints
Scaling beyond ~1,500 concurrent workers was limited by available memory.
Oversubscription of memory prevented further horizontal scaling, especially under KEDA.
Expanding node memory or reducing per-worker memory footprint is necessary for future growth.
Middleware Speedup Attempts
Two candidate middleware optimizations to improve export throughput were tested, but neither provided sufficient gains to unblock scaling.
Quick Stack Workflow Validation
The “quick stack” process—used to build prompt images from local branches without a full stack release—was exercised successfully.
Minor issues were identified, but the workflow is expected to be critical during commissioning for rapid bug fixes and validation.
Path Forward#
Redesign dataset registration flow to eliminate bottlenecks during export (see DMTN-310)
Investigate and resolve the Knative scaling ceiling; consider deprecating Knative in favor of KEDA for prompt operations
Expand memory capacity or optimize per-worker resource usage to allow scaling beyond 1,500 workers
Continue performance testing with additional focus on APDB behavior and full-system throughput under realistic workloads
In summary, prompt processing pipelines performed well when isolated from export overhead. However, a reliable, scalable architecture for output registration is essential before we can sustain LSSTCam-scale prompt operations during commissioning and survey operations.
Conclusion#
Operations Rehearsal 5 (OR5) was a clear demonstration of the iterative nature of scaling Rubin’s data processing systems: find the bottleneck, fix the bottleneck, and test again to find the next one. This process surfaced unexpected bottlenecks and we are learning where the system struggles under LSSTCam-scale loads.
Many of the bottlenecks we discovered in both Batch and Prompt Processing would not have been identified at smaller scales. In DRP, we already see signs of inefficiency and underutilization — indications that more optimization and scaling work is required as we look toward Data Release 1 (DR1). In Prompt Processing, the tests revealed critical architectural constraints that we must resolve to ensure stable, real-time alert generation once we’re observing.
Targeted full-scale tests that push the system to LSSTCam-scale followed by rapid iteration will continue:
Prompt Processing will begin regular scale tests, enabling fast experimentation and continuous improvement.
Planning is underway for OR5 Part II, currently scheduled for the week of April 7.
Every night of LSSTCam commissioning will generate valuable data — for testing both pipelines and telescope behavior. Every issue we can solve before we go on-sky increases the likelihood that those nights will be productive and informative.
This rehearsal helped de-risk many failure modes before we’re under the pressure of real-time operations. The more we solve now, the fewer surprises we’ll face during on-sky chaos — and the faster we’ll converge on a well-running observatory.
Thank you to everyone who had their eyes on the processing during OR5.